DecentWealth v1.3: Precious Metals, Live Market Status, and Benchmark Comparison
Key Takeaway
DecentWealth 1.3 is our biggest update yet: • Precious Metals Tracking: Track Gold, Silver, Platinum, and Palladium using live hourly spot prices with automatic unit conversions. • Live Market Status: A new animated green/grey dot next to every stock shows whether its exchange is open or closed, optimizing background data refreshes to save battery. • Benchmark Comparison: Directly plot your historical portfolio returns against the S&P 500, NASDAQ, DAX, or Bitcoin, featuring an "Outperformance Badge". • Sector Allocation: A new analytics chart breaks down your stocks by industry sector while cleanly isolating ETFs, commodities, and crypto. • 12 Supported Languages: Full native localization added for Japanese, Korean, Portuguese, and Turkish. • Absolute Privacy: As always, no accounts are required, no external servers are used, and all data remains securely on your device.
Version 1.3 is the biggest update since launch. We added an entirely new asset class, gave every stock a live market status indicator, and built a benchmark comparison chart so you can finally see how your portfolio measures up against the market. Here's what's new.
1. Precious Metals Tracking: Gold, Silver, Platinum, and Palladium
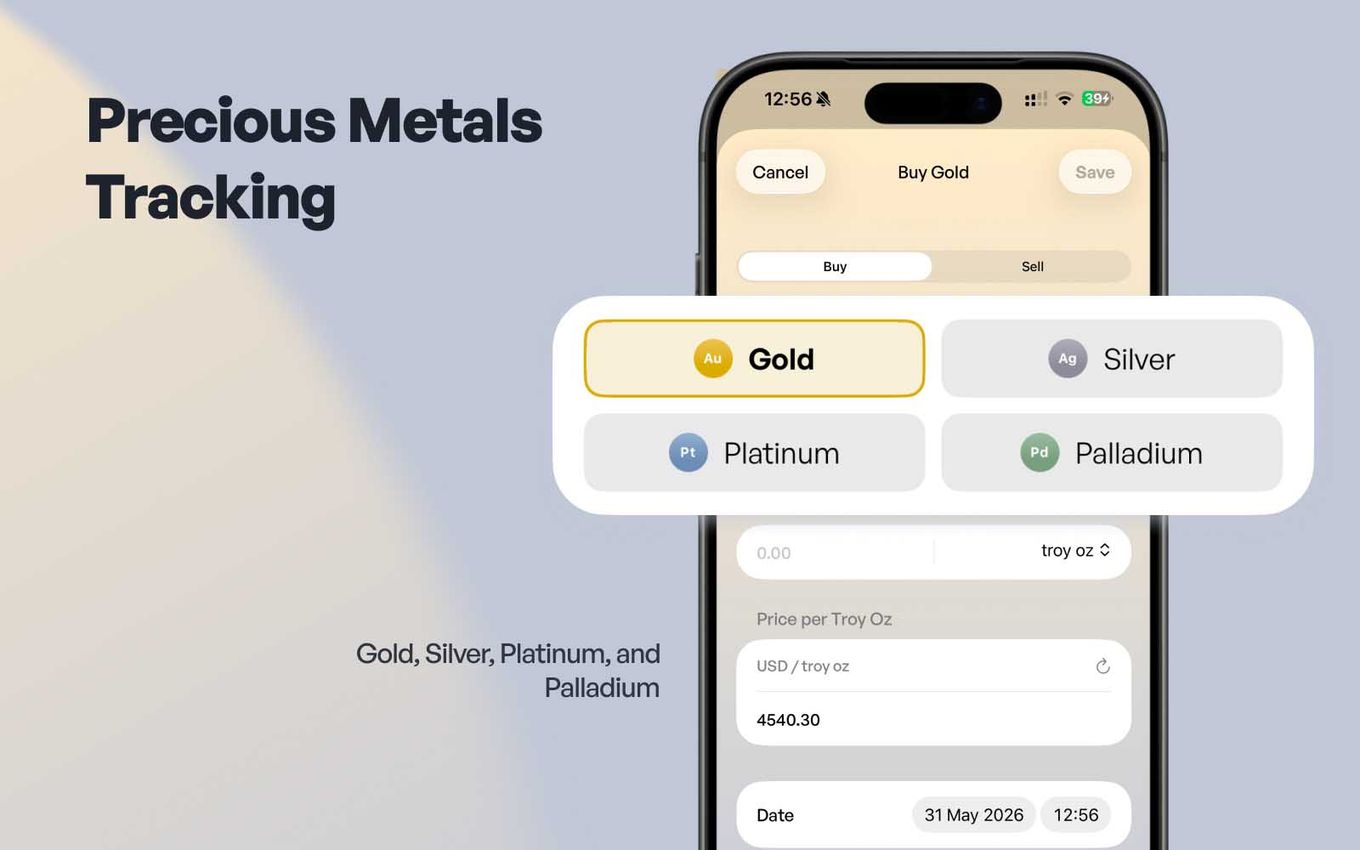
Gold, Silver, Platinum, and Palladium are now officially supported as first-class assets in DecentWealth. If you use a physical asset tracker to build a diversified all-weather portfolio, you no longer have to manage your bullion through awkward workarounds or static manual property fields.
Streamlined, Automatic Valuations
Simply input your physical holdings into the app. DecentWealth automatically fetches live spot prices updated every single hour — without requiring an API key, a paid premium subscription, or forcing you to sit through data delays.
- Flexible Units: Enter your weight in troy ounces, grams, or kilograms. The app handles all conversions under the hood instantly.
- Visual Integration: Your metals automatically populate your portfolio allocation chart as their own distinct category, sitting cleanly alongside your equity and crypto holdings.
True Self-Custody and Privacy
This feature relies on the exact same privacy-first architecture that defines our app. All commodity prices are pulled directly by your device from a public API. Absolutely nothing passes through our servers, meaning your total net worth and asset quantities stay strictly on your device.
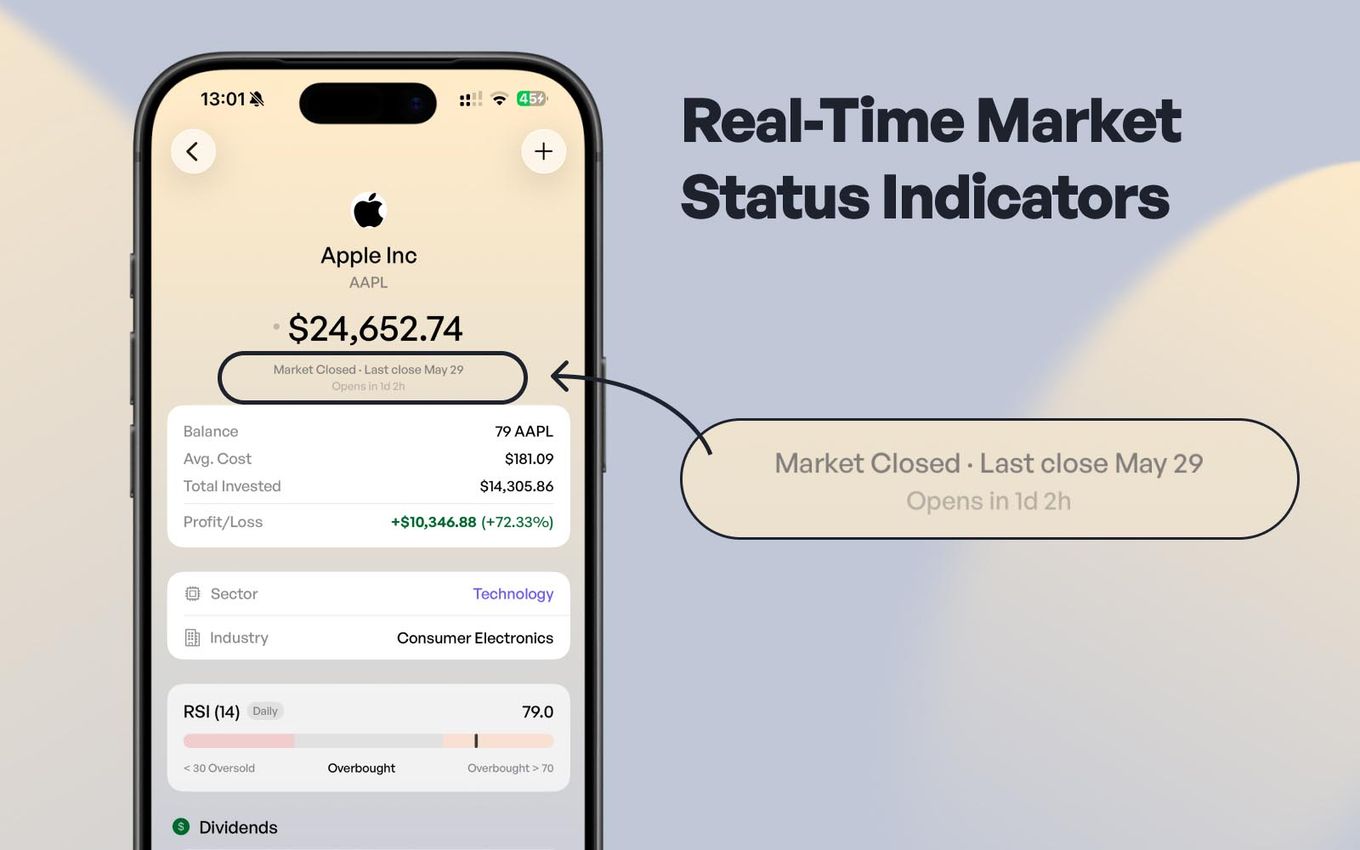
2. Real-Time Market Status Indicators (Open vs. Closed)
Looking at a stock ticker is only helpful if you know whether the data is moving. With version 1.3, we are making it entirely transparent whether your portfolio's equity prices are live or stale.
Every single stock and ETF row in your dashboard now features a subtle, live market status dot right next to the current price:
🟢 Green and Breathing: The respective exchange is open right now, trades are executing actively, and your pricing data is updating in real time.PDF
⚪ Static Grey: The local market is closed, signaling that you are looking at the final, last-known closing price.
Supported Global Exchanges
Our built-in market clock automatically handles the nuances of major global financial hubs, mapping out trading hours perfectly:
- US Markets: NYSE / NASDAQ (9:30 AM – 4:00 PM ET)
- European Markets: Major continental exchanges (9:00 AM – 5:30 PM CET)
- UK Markets: London Stock Exchange (8:00 AM – 4:30 PM GMT)
Smart Battery Optimization: We have wired our background refresh logic directly to these exchange schedules. When at least one of your equity markets is live, prices pull an update every 90 seconds. The moment all your exchanges close, the app automatically throttles back to a 5-minute cycle. This keeps the app incredibly responsive during active trading hours while drastically reducing battery drain overnight.
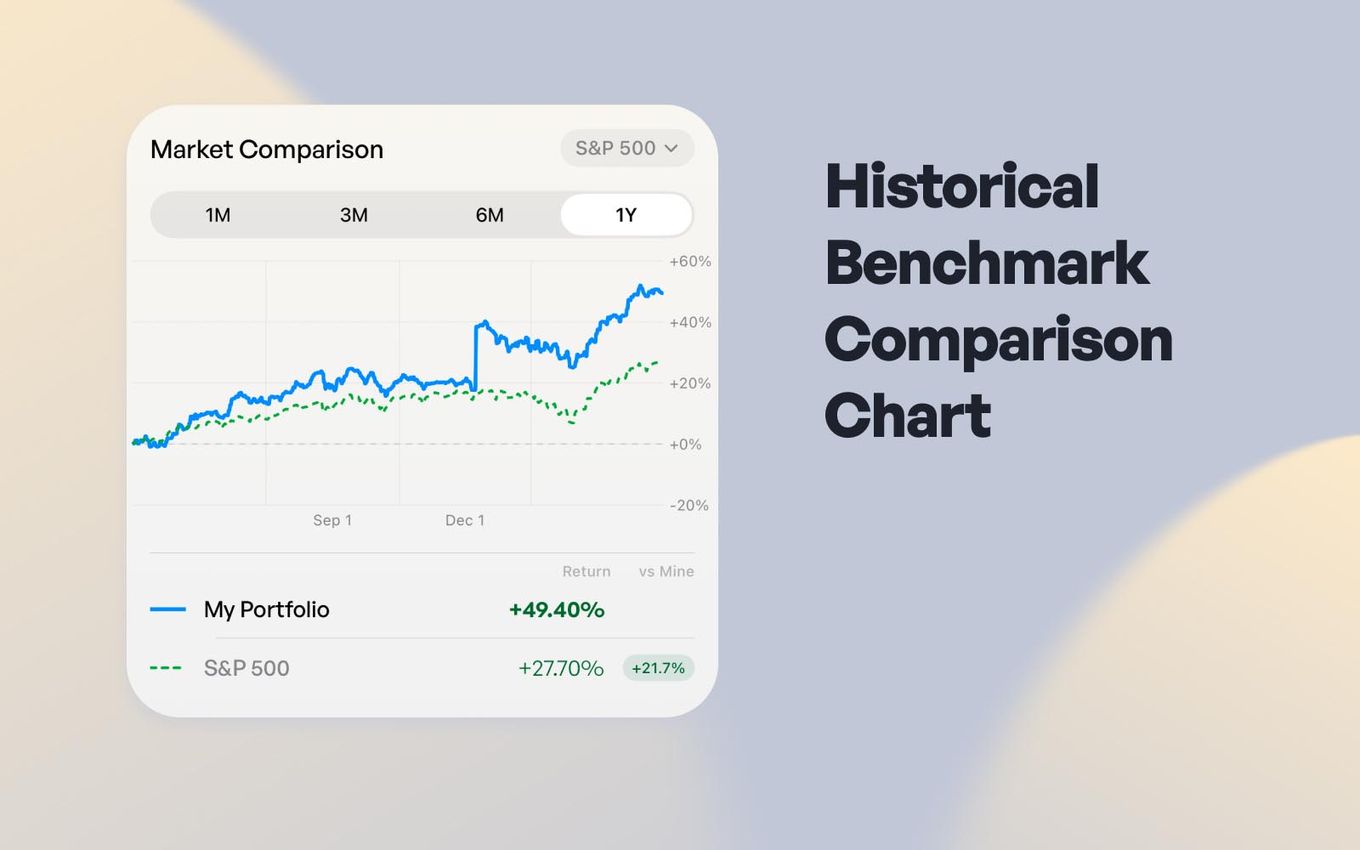
3. Historical Benchmark Comparison Chart
This feature explicitly answers the number one question data-driven investors ask themselves: “Am I actually making smart investment decisions, or does it just look that way because the broader market is in a bull run?”
The brand new Market Comparison chart inside the Analytics tab normalizes your unique portfolio returns and plots them over an identical timeline against major global indexes and assets.
The Outperformance Badge
Simply pick your target timeframe, choose your relative benchmark, and see the performance gap immediately. A built-in Outperformance Badge calculates and displays the exact percentage points you are leading or lagging behind the market. This gives you the precise quantitative feedback needed to grade your asset allocation choices.
4. Visual Sector Allocation Breakdown
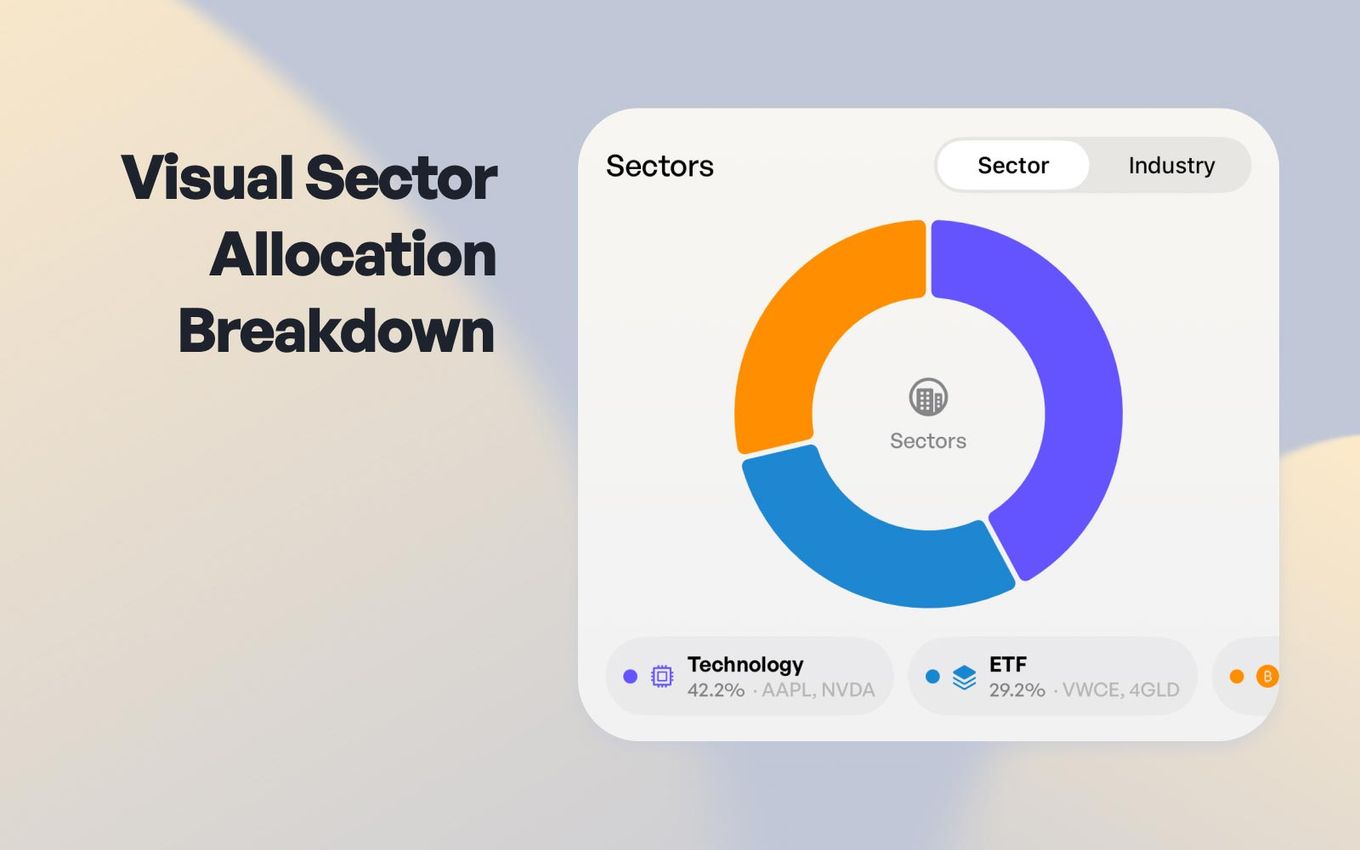
Achieving structural diversification requires knowing exactly where your capital is concentrated. Our newest analytics visualization breaks down your equity investments directly by industry sector.
Your equities are organized across standard macroeconomic spaces, including:
- Technology
- Healthcare
- Financials
- Consumer Discretionary
- Energy
To ensure your analytics remain perfectly clean, commodities and cryptocurrencies are isolated into their own dedicated asset groups rather than cluttering your stock charts. Most importantly, ETFs stay separated in their own classification. This prevents broad-market index funds from being misclassified into an individual industry sector, keeping your concentration risk assessment highly accurate.
5. Technical Insights: Built-In Daily RSI Indicator
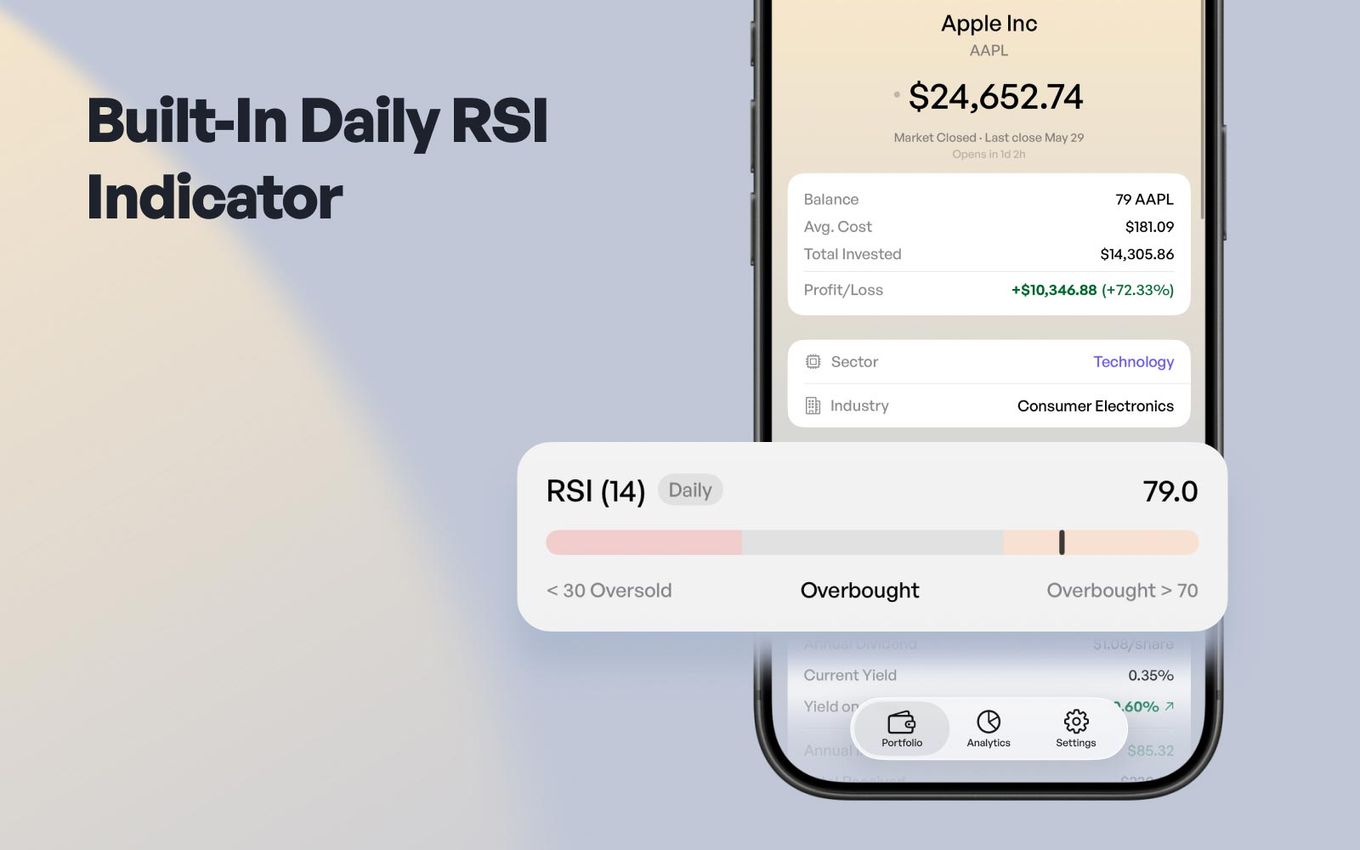
Timing your portfolio additions or rebalancing shouldn't require you to constantly switch back and forth to heavy, external charting software. In version 1.3, we have integrated a clean, minimalist Daily RSI indicator directly into your asset detail views to give you instant context on market momentum.
This addition brings institutional-grade momentum data right to your fingertips, helping you make smarter dollar-cost averaging (DCA) decisions without compromising our zero-telemetry, privacy-first data promise.
6. Global Localization: 12 Languages Fully Supported
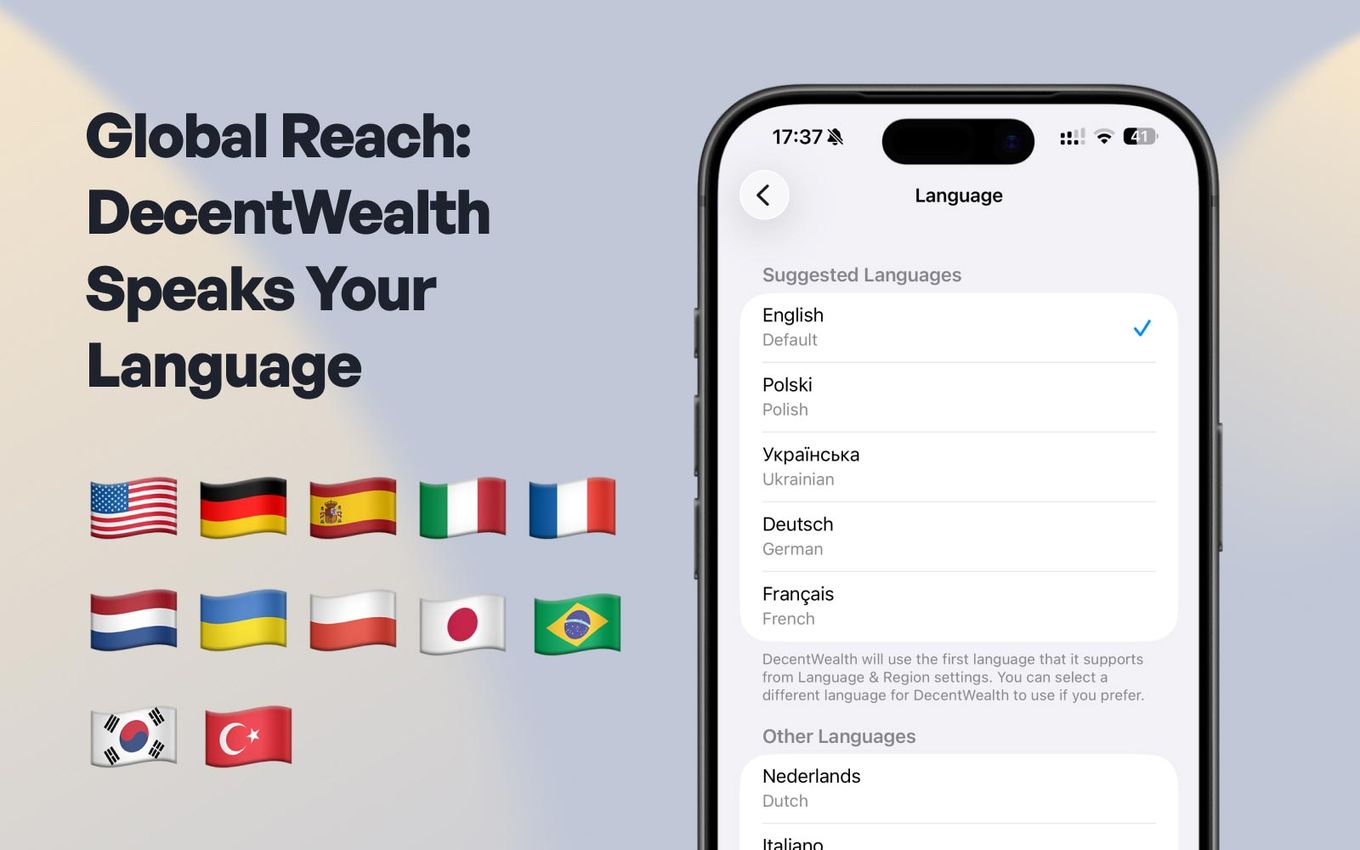
Financial sovereignty is easiest to navigate when the interface speaks your native tongue. In this release, we have expanded our global footprint by rolling out comprehensive localization for four new languages: Japanese, Korean, Portuguese, and Turkish.
With these additions, DecentWealth now fully supports a complete suite of 12 distinct languages:
🇬🇧 English 🇩🇪 German 🇪🇸 Spanish 🇮🇹 Italian 🇫🇷 French 🇳🇱 Dutch 🇵🇱 Polish
🇺🇦 Ukrainian 🇯🇵 Japanese 🇰🇷 Korean 🇧🇷 Brazilian Portuguese 🇹🇷 Turkish
This is a deep, comprehensive localization layer. We didn't just translate the main dashboard; every setting screen, interactive analytical label, and system error message has been natively translated to ensure an intuitive user experience worldwide.
Get the Update Today
Version 1.3 is officially live and available for download on the iOS App Store.
As always — no accounts, no tracking links, no external servers. Your financial data stays yours.
Frequently Asked Questions
How does the Benchmark Comparison chart handle different currencies or timeframes?
Does fetching live spot prices or market data expose my personal portfolio to external servers?
Why aren't my ETFs broken down in the Sector Allocation chart?
What languages does DecentWealth support?
Can I log my precious metals in different weight units, or do I have to convert them manually?
Track your portfolio privately
Stocks, crypto, real estate, and more. No account required.