Dividend DRIP Calculator
See how reinvesting dividends compounds your portfolio value and annual income over time. Enter your numbers below and get a full projection instantly, with no account and no data sent anywhere.
Investment details
The amount you are investing today in dividend-paying assets.
Starting annual dividend as a percentage of share price. Broad market ETFs: 1.3-2%. Dividend ETFs: 3-5%.
How much the dividend per share increases each year, independent of price.
Expected annual stock price growth. Use 6-7% for dividend-focused stocks or ETFs.
Additional cash invested each month to buy more dividend-paying shares.
Set to 0% for tax-advantaged accounts (IRA, 401k). Use 15-20% for taxable accounts.
Final portfolio value
$56,044
Annual income by year 20
$3,461
Projected dividend payout
Total dividends collected
$14,730
Cumulative over period
Your strategy is ready. Now execute it privately.
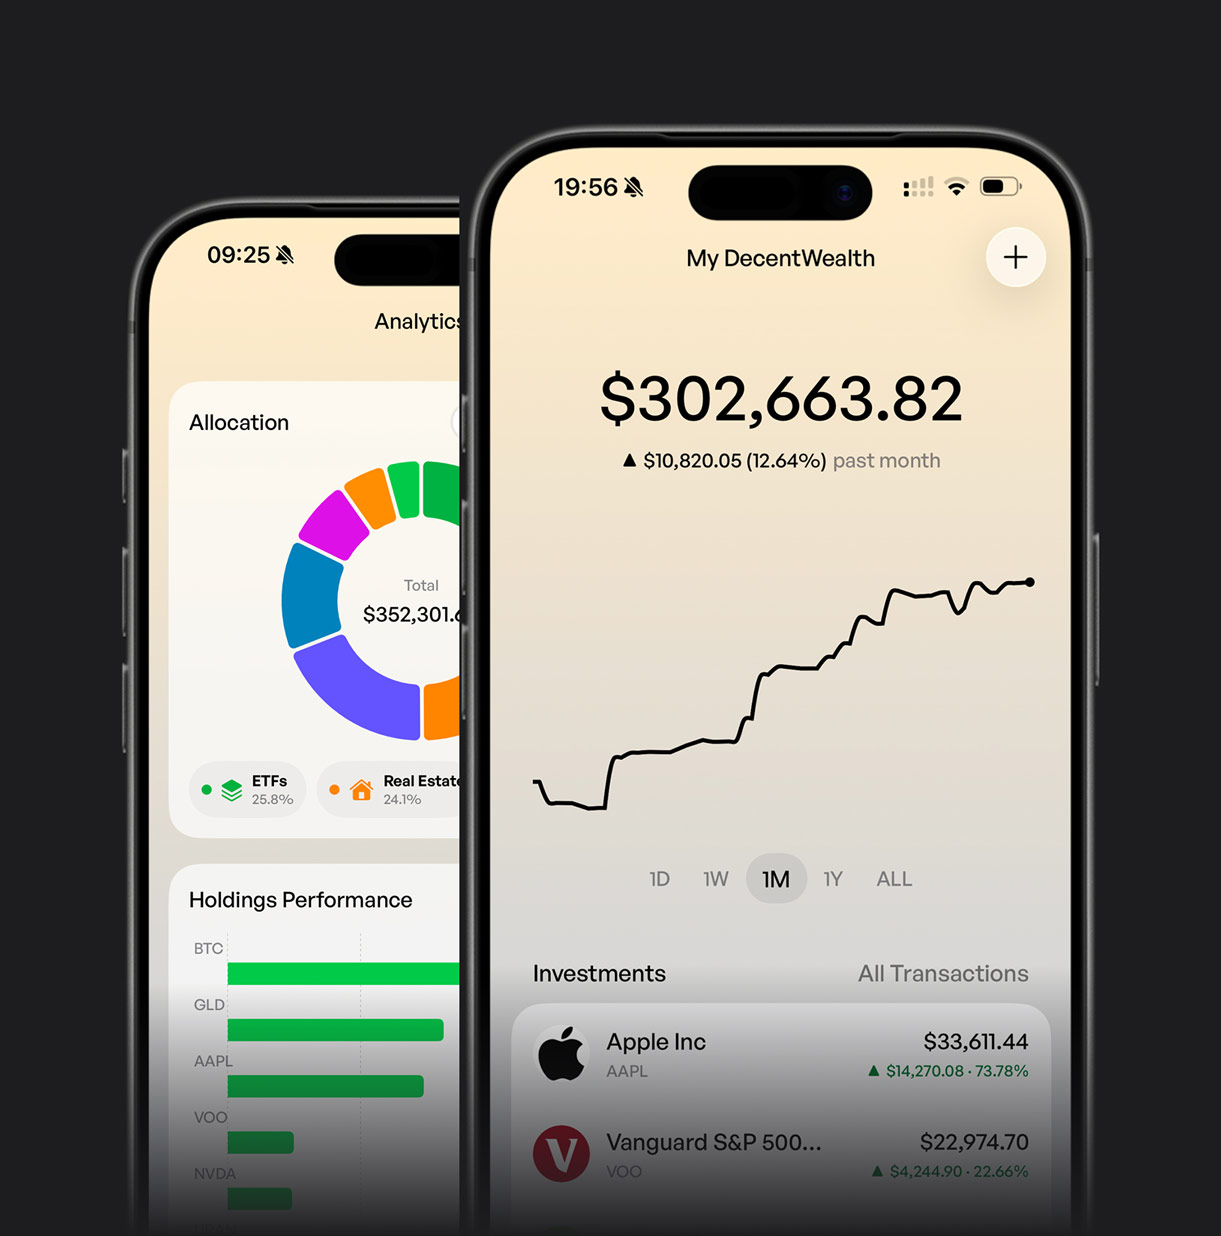
DecentWealth tracks your real portfolio on your iPhone, with no accounts, no syncing, and no data sent anywhere. Your numbers stay on your device.


How to use this dividend DRIP calculator
Enter your initial investment, your starting dividend yield, how fast dividends grow each year, how fast the stock price appreciates, and your time horizon. The calculator reinvests dividends annually and shows you the compounded result: final portfolio value, projected annual dividend income, and total dividends collected over the period.
Use the advanced options to add a monthly contribution or apply a dividend tax rate. Set the tax rate to 0% to model a Roth IRA or 401(k) where dividends compound tax-free. Use 15% to 20% to model a taxable brokerage account with qualified dividends.
What is a DRIP and why does it work?
A Dividend Reinvestment Plan (DRIP) uses each dividend payment to buy additional shares of the same investment instead of paying out cash. Those new shares generate their own dividends the following period, which are reinvested again. This is compounding applied to income: not just your returns growing on themselves, but your share count growing on itself.
Take the calculator's own defaults: $10,000 invested, a 3.5% yield, dividends growing 5% a year, the share price growing 7% a year, twenty years, no tax and nothing added along the way. Reinvested, that becomes $69,114, of which $16,466 is dividends that bought more shares. Take the dividends in cash instead and the holding is worth $38,697 with $11,573 collected along the way, so $50,270 in total. The gap is $18,844, and all of it comes from dividends that were themselves earning dividends.
The longer the time horizon, the wider the gap between DRIP and no-DRIP outcomes. Reinvestment does most of its work in the final years of a long holding period.
Reinvest or take the cash?
Reinvesting wins on total value, and the margin widens the longer the money is left alone. The figures below come from the calculator above, on its default settings: $10,000 invested, a 3.5% starting yield, dividends growing 5% a year, the share price growing 7% a year, no tax and no monthly contributions. The cash column counts both what the holding is worth and every dividend taken out of it.
| Held for | Dividends reinvested | Dividends taken as cash |
|---|---|---|
| 10 years | $27,006 | $19,672 held, $4,402 taken, $24,074 together |
| 20 years | $69,114 | $38,697 held, $11,573 taken, $50,270 together |
| 30 years | $169,137 | $76,123 held, $23,254 taken, $99,377 together |
At ten years reinvesting is ahead by about 12%. At thirty it is ahead by 70%. That shape is the whole argument for leaving a dividend portfolio alone, and it is also why the choice matters most early: the shares bought in year three are the ones still paying in year thirty.
What the tax field does, and what it cannot know
The tax rate you enter is applied to each dividend before it buys new shares, which is how a taxable account behaves: the broker withholds, and only what is left is reinvested. Set it to zero for an account where dividends are not taxed as they arrive, such as a Roth IRA in the United States or an ISA in the United Kingdom.
What it cannot do is model your jurisdiction. Withholding on foreign dividends, allowances, and the treatment of accumulating funds all vary by country and by year, and none of that is knowable from a single percentage. The figure is a straight haircut on each payment, useful for comparing scenarios and not a substitute for advice on your own return.
Dividend yield vs dividend growth rate
These are two separate inputs that are often confused. Dividend yield is the current annual payout as a percentage of the share price: a $50 stock paying $1.75 per year has a 3.5% yield. Dividend growth rate is how much that $1.75 increases per year, independent of the share price.
A company with a modest 2% yield but a consistent 8% annual dividend growth rate will pay more per share within ten years than one starting at 5% yield but growing dividends by only 2% per year. Over long periods, dividend growth often matters more than the starting yield.
Dividend Aristocrats, a group of S&P 500 companies that have raised dividends for 25 or more consecutive years, have historically averaged dividend growth rates between 5% and 8% per year. This calculator lets you test any combination to see which profile fits your goals best.
Common questions
What is dividend reinvestment (DRIP)?
A DRIP, or Dividend Reinvestment Plan, automatically uses dividend payments to purchase additional shares of the same stock or fund instead of paying cash to the investor. Each new share then generates its own dividends, which are reinvested again. Over time, this compounding effect significantly increases both your share count and your total dividend income.
How does this DRIP calculator work?
The calculator starts with your initial investment and applies your dividend yield to compute the first year of dividend income. Those dividends are reinvested to buy more shares. Each subsequent year, the stock price grows at your appreciation rate, the dividend per share grows at your dividend growth rate, and the updated share count generates a larger dividend payout that is reinvested again.
What is a good dividend yield?
For broad market index funds, dividend yields typically range from 1.3% to 2% annually. For dividend-focused ETFs and stocks, yields of 3% to 5% are common. Yields above 6% may signal elevated risk, as a very high yield can reflect a falling share price rather than a strong business. Most long-term dividend investors target the 2.5% to 4.5% range for a balance of income and growth.
What is dividend growth rate and why does it matter?
Dividend growth rate is how much the dividend per share increases each year, independent of the stock price. A company that starts paying $1 per share annually and grows that payout by 6% per year will pay $1.79 per share in ten years. Over long holding periods, dividend growth often matters more than the starting yield because it means each existing share produces more income every year.
Should I reinvest dividends or take the cash?
If you do not need the income now, reinvesting produces meaningfully larger long-term results because of the compounding effect on share count. If you are in or near retirement and need the cash flow, taking dividends as income makes sense. Otherwise, reinvestment is almost always the better mathematical choice for wealth accumulation.
What stock appreciation rate should I use?
For broad market index funds, 7% to 9% per year is a common long-term assumption. For dividend-focused stocks and ETFs, which tend to be more mature businesses, 5% to 7% is more typical. The S&P 500 has averaged approximately 10% per year since 1957 before inflation. For conservative planning, 6% to 7% is a reasonable middle ground.
Does dividend reinvestment work in tax-advantaged accounts?
Yes. In tax-advantaged accounts like Roth IRAs and 401(k)s, dividends compound without a taxable event, which maximizes the DRIP effect. In taxable brokerage accounts, dividends are taxed in the year they are paid even if reinvested, reducing the amount available for reinvestment. Set the tax rate to 0% in this calculator to model a tax-advantaged account.
Is my data saved or sent anywhere?
No. This calculator runs entirely in your browser. Your financial numbers are never sent to our servers, stored in a database, or shared with any third party. You can use it freely without creating an account.
More financial calculators
Investment Calculator
See how your money grows over time with compound interest. Enter your starting amount, monthly contribution, and return rate for an instant projection.
Try itFIRE Calculator
Find your Financial Independence number and see exactly when you can retire early based on your savings rate and annual expenses.
Try itRetirement Calculator
Calculate how much you need to save to retire comfortably at your target age, accounting for inflation and expected withdrawals.
Try it