How to Track a Dividend Portfolio Without a Spreadsheet
Key Takeaway
Spreadsheets work for tracking dividends until they don't. Once you hold more than a handful of stocks and ETFs, managing ex-dates, payment schedules, yield on cost, and income projections in a spreadsheet becomes a part-time job you didn't sign up for. DecentWealth is a free dividend tracker for iPhone that shows your full dividend calendar, annual income projections for up to 25 years, and yield per holding. No account, no brokerage login, no subscription for dividend features. Add your tickers and share counts, and the calendar populates itself from 30+ years of historical dividend data. Your data stays on your iPhone.
Somewhere, right now, a dividend investor is updating a Google Sheet. They're pulling up Nasdaq.com in one tab to check an ex-date. They're referencing SeekingAlpha in another tab to confirm a payout amount. They're typing a GOOGLEFINANCE formula that worked last Tuesday but returns an error today for reasons known only to Google's API.
They have 14 holdings. The spreadsheet has 23 columns. Three of those columns are color-coded in a system they invented and no longer fully remember.
This person is not lazy. They're disciplined enough to build a dividend portfolio, which takes real patience, but they picked the wrong tool to track it.
If any of this sounds familiar, this article is for you.
Why spreadsheets work at first (and then stop working)
When you own three or four dividend stocks, a spreadsheet is fine. You list the ticker, the share count, the annual dividend per share, maybe a column for yield on cost. Simple, clean, satisfying.
Then you add a fifth stock. And a sixth. You buy an ETF that pays monthly instead of quarterly. You start tracking ex-dates because you want to know when to expect payments. You add a column for dividend growth rate because you read about it on r/dividends and now you care about it.
Suddenly your tracking sheet needs to answer questions it was never designed for:
- When is my next payment, across all holdings?
- How much total income am I getting this year?
- What does my income look like in five years if dividend growth stays consistent?
- What's my yield on cost versus my current yield?
- Which holdings are pulling their weight and which ones are lagging?
A spreadsheet can technically answer all of these. But you have to build and maintain the formulas yourself. You have to update the data manually. And every time a company announces a special dividend, changes its payment schedule, or you add a new position, you're back in the spreadsheet adjusting things.
At some point you're spending more time maintaining the tracking system than actually thinking about your portfolio. That's the moment the spreadsheet stopped serving you and started being a chore.
The ex-date problem
If you own 10 to 15 holdings across different payment schedules (some quarterly, some monthly, some on offset calendars), you're dealing with 40 to 60 ex-dates per year. Each one has a corresponding pay date. Each one has a different per-share amount. Some of them shift by a day or two from quarter to quarter.
Tracking this in a spreadsheet means either manually entering every date (tedious and error-prone) or building an elaborate formula system that pulls from an external data source (fragile and often broken by API changes).
Most dividend investors give up on tracking ex-dates in their spreadsheet and just check each holding individually on their brokerage app. Which means the "single source of truth" benefit of the spreadsheet quietly disappears. You're back to checking multiple places and doing mental math.
A proper dividend tracker solves this by maintaining a calendar that populates automatically. You add your holdings and the app handles the schedule. That's the job. It shouldn't require engineering.
What a dividend tracker actually needs to do
Before looking at specific tools, it helps to define what "tracking dividends" actually means in practice. Not in theory, not in a blog post about passive income lifestyle, but in the day-to-day of managing a real portfolio.
- Show me when I'm getting paid. A calendar view with ex-dates and pay dates for every holding. Not a table I have to sort and scan. A calendar. Like the one on my phone, but for money coming in.
- Show me how much I'm getting paid. Total projected income for the current year, broken down by month or quarter. Per holding and in aggregate. Bonus if it shows what that number looks like next year, and the year after that.
Show me yield on cost, not just current yield. Current yield tells you what a new buyer gets. Yield on cost tells you what your money is earning based on what you paid. If you bought SCHD three years ago at a lower price, your yield on cost is higher than the ticker page shows. That's the number that matters to someone building a long-term dividend portfolio.
Don't make me connect my brokerage. This one might seem like a personal preference, but it's practical. Brokerage connections break. They require re-authentication. They give a third-party app access to your full account. For something as straightforward as "I own 50 shares of JNJ," manual entry is faster and more reliable than OAuth flows and API tokens.
Keep it on my device. Your dividend income, your holdings, your projected cash flow. This is detailed financial information. It should live on your phone, not on someone else's server next to a million other users' portfolios.
How DecentWealth handles it
DecentWealth is a free dividend tracker for iPhone that does all of the above. Here's how the actual experience works.
You download the app (no account, no email, no sign-up). You search for a ticker, enter your share count and purchase price. The app pulls dividend data from 30+ years of historical records and fills in the calendar automatically.
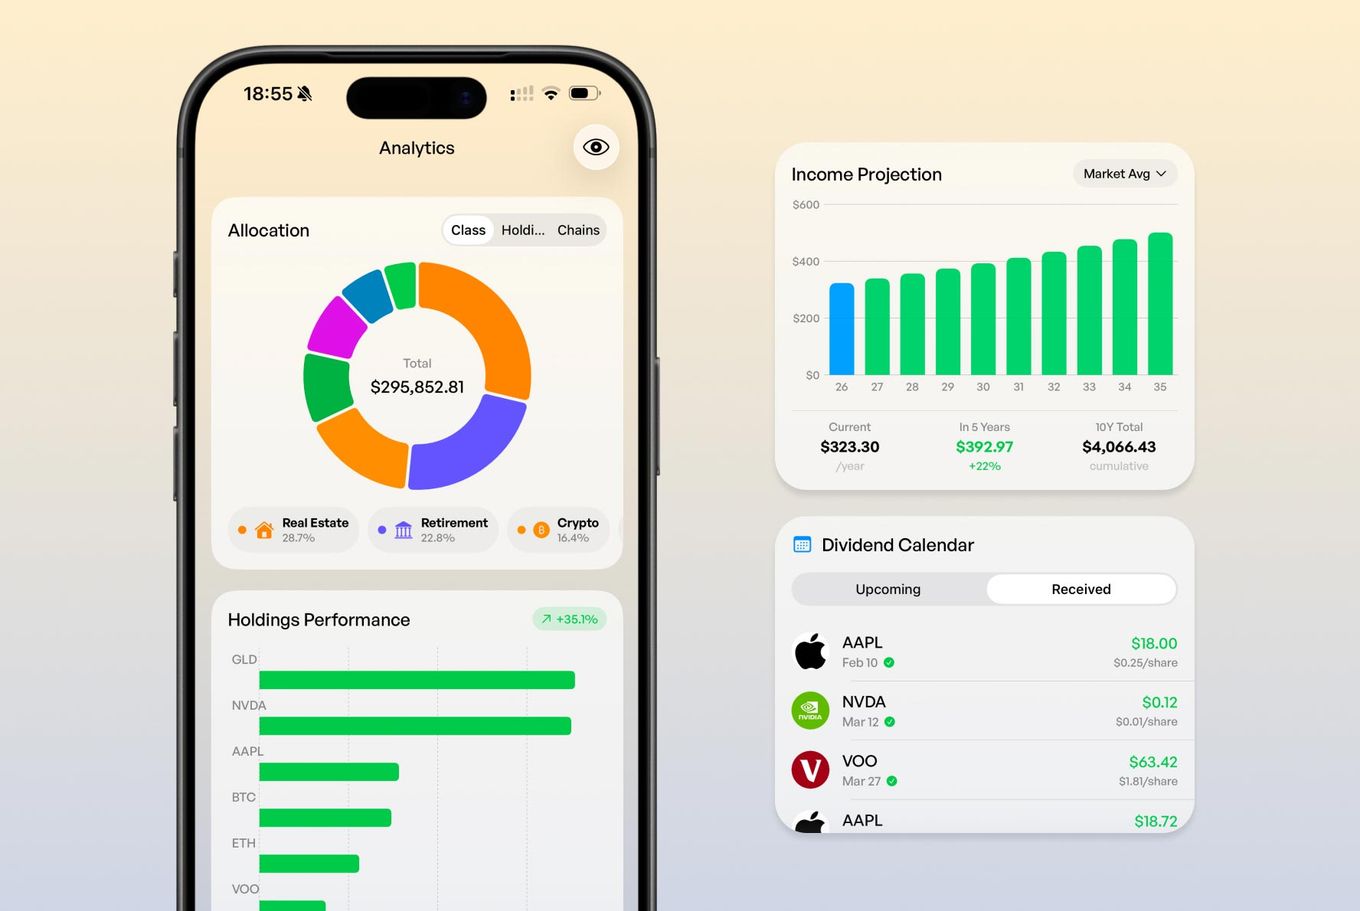
Your dividend calendar shows upcoming ex-dates and pay dates for every holding, laid out visually so you can see at a glance what's coming this week, this month, this quarter. No manual date entry. No formulas. No copy-pasting from Nasdaq.com.
Annual income projections extend up to 25 years. This is based on your current holdings and historical dividend data, so you can see what your portfolio's income trajectory looks like without building a growth model in a spreadsheet. It's the kind of projection that would take an afternoon to set up in Google Sheets and still probably have a broken cell reference somewhere.
Yield on cost is calculated per position automatically. You entered your purchase price when you added the holding. The app knows the current dividend. The math is instant.
And none of this data leaves your iPhone. There's no account, no server storing your portfolio, no analytics tracking what you hold. Your dividend data stays on your device, locked behind Face ID.
The spreadsheet tax: how much time are you actually spending?
Let's be honest about the hidden cost of the spreadsheet approach.
Updating dividend data for a 15-stock portfolio takes roughly 20 to 30 minutes per quarter, assuming you're checking ex-dates, confirming payout amounts, and adjusting for any changes. That's about two hours per year just on data entry.
Building the spreadsheet in the first place (with income projections, yield on cost calculations, and a calendar view) takes anywhere from two to six hours depending on how thorough you are. And that's if you know your way around spreadsheet formulas. If you're learning as you go, double it.
Then there's the maintenance. A formula breaks because Google changed something. A new holding doesn't fit the structure you built. You want to add a feature (like a DRIP simulation) and realize it would require rearchitecting half the sheet.
None of this time is spent thinking about your investments. It's spent maintaining a tool. There's a difference between managing a portfolio and managing a spreadsheet about a portfolio.
An app that handles the data automatically gives you that time back. And more importantly, it lets you focus on the decisions that actually affect your income: which positions to add, whether to reinvest or take cash, when to trim a position that cut its dividend.
"But I like my spreadsheet"
Respect. Genuinely.
Some people enjoy the process of building and maintaining a financial model. If your spreadsheet is a hobby that brings you satisfaction, keep it.
But if you're being honest with yourself and the spreadsheet stopped being fun about eight months ago, and now it's just a thing you feel obligated to update, that should be changed.
There must be a better use of your time when a purpose-built tool does the same job automatically, on your phone, for free, without sending your financial data to a server.
Beyond dividends: seeing the full picture
Here's the thing that changes when you move from a spreadsheet to a proper tracker. You start seeing your dividends in context.
A spreadsheet shows you dividend income in isolation. Useful, but incomplete. Your dividend stocks are part of a larger financial picture that probably includes growth stocks, index ETFs, maybe some crypto, a retirement account, real estate equity.
DecentWealth tracks all of it. Over 100,000 stocks and ETFs, crypto across 16 blockchain networks, real estate, retirement accounts, vehicles, cash, and loans. Your dividend portfolio sits alongside everything else in a single net worth view.
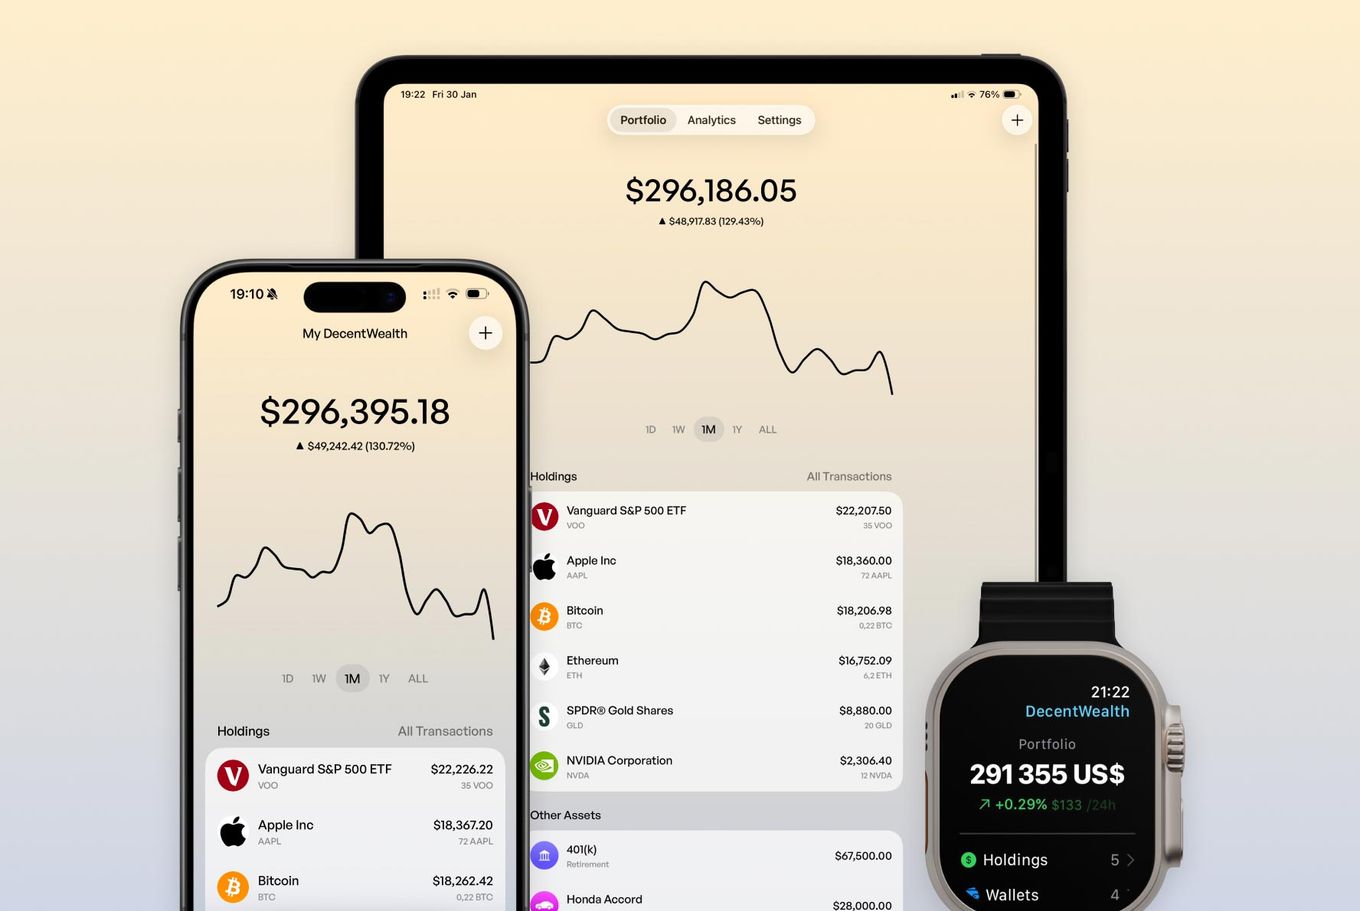
This matters because allocation decisions don't happen in a vacuum. If your dividend stocks are 60% of your portfolio and the rest is concentrated in one crypto position, that's useful to know. If your dividend income covers 40% of your living expenses but your net worth is heavily weighted toward illiquid assets, that's useful too.
A spreadsheet that only tracks dividends can't show you this. A portfolio tracker that covers everything can.
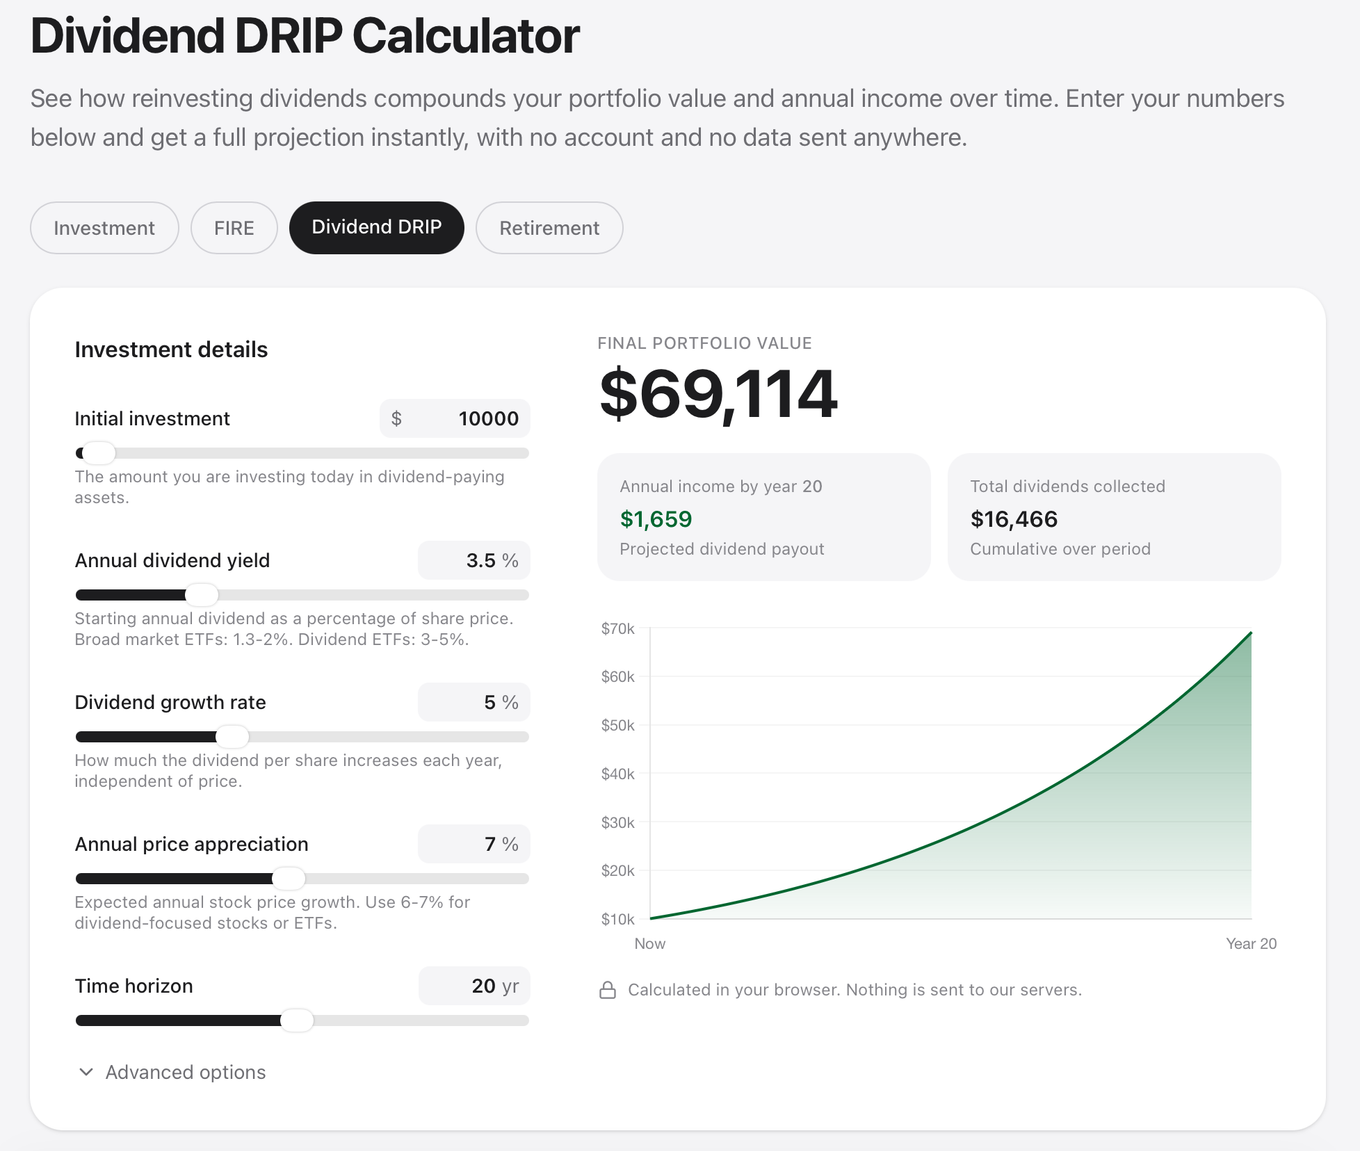
Model your dividend growth with the DecentWealth Dividend DRIP Calculator. Plug in your current yield, expected dividend growth rate, and time horizon to see how reinvestment compounds your income over time. Runs in your browser, nothing stored, nothing sent anywhere.
Or download DecentWealth free on the App Store and see your actual dividend calendar in under a minute.
Frequently Asked Questions
What's the best way to track dividends without a spreadsheet?
Can I track dividend ex-dates and pay dates on my iPhone?
How do I calculate yield on cost for my dividend stocks?
Is there a free dividend tracker that doesn't require an account?
Can I see projected dividend income for the next 5, 10, or 25 years?
Do I need to connect my brokerage to track dividends?
Track your portfolio privately
Stocks, crypto, real estate, and more. No account required.