Track Your 2026 Payouts: The Power of a Private Dividend Calendar
Key Takeaway
Every dividend has four dates. The ex-dividend date is the one that matters: miss it and you don't get paid. The S&P 500 hit a record $78.92 per share in dividends in 2025, with 81% of its companies paying regular dividends and mid-single digit growth expected for 2026. The Dividend Aristocrats (69 companies with 25+ consecutive years of payout increases) have averaged about 6% annual dividend growth over the past decade, which means a 2.5% yield today could become 4%+ on your original cost within ten years if you just hold. DRIP (reinvesting dividends to buy more shares) is where the real compounding happens, and most of its impact shows up in the final years of a long holding period. If you want to model it, the DecentWealth Dividend DRIP Calculator runs in your browser with no account required. When you're ready to track real payouts across your whole portfolio, DecentWealth keeps your dividend calendar, income projections, and financial data on your device.
Your Dividend Calendar Is a Mess
There's a particular kind of chaos that happens when you own seven or eight dividend-paying stocks across two brokerages and a retirement account.
Payments show up on different days. Some are quarterly, some are monthly, one random REIT pays you on the 15th for reasons nobody can explain. You know money is coming in, but you couldn't tell someone exactly how much or exactly when without doing homework first.
That's not a great feeling for someone trying to build a passive income strategy.
A dividend calendar fixes this. It's a single view of every payout date, every amount, and every holding that's generating income for you. And once you have one, you start seeing your portfolio differently. Not just as a collection of tickers with green and red percentages, but as an income machine with a schedule.
How Dividends Work (The Four Dates That Matter)
Every dividend payment follows a four-step lifecycle. Most investors only pay attention to one of them (the day money shows up). But the second one on this list is the one that can actually cost you money if you're not tracking it.
- Declaration Date. The company's board announces the dividend: the amount per share and the relevant dates. This is when the dividend becomes official. For most established companies, it's a formality. For newer or smaller dividend payers, it's worth watching because this is where cuts or freezes get announced too.
- Ex-Dividend Date. This is the one that matters. You must own shares before this date to receive the upcoming payment. If you buy on the ex-dividend date or after, you're too late. The stock price typically drops by roughly the dividend amount on this date, because new buyers aren't getting the payout. If you've ever bought a stock and wondered why it dipped the next morning for no apparent reason, this is probably why.
- Record Date. Usually one business day after the ex-dividend date. The company checks its shareholder list and confirms who's getting paid. You don't need to do anything here. If you owned shares before the ex-date, you're on the list.
- Payment Date. Cash hits your brokerage account. This can be anywhere from two to six weeks after the ex-date, depending on the company. If you have DRIP enabled, the cash automatically buys more shares instead.
Why this matters for your calendar: If you're managing cash flow, planning reinvestments, or timing new purchases around dividend capture, you need to see ex-dates and payment dates across your entire portfolio at a glance. Not stock by stock. Not brokerage by brokerage. All of it, in one place.
Dividends in 2026: Boring Is Back (And Paying Well)
After a few years of everyone chasing AI stocks and meme coins, dividends are having a quiet moment. Not a flashy moment. A quietly-putting-cash-in-your-pocket moment.
The S&P 500 paid a record $78.92 per share in dividends during 2025, according to S&P Dow Jones Indices. That was the index's 16th consecutive annual increase and 14th consecutive record payout. For 2026, analysts expect mid-single digit growth on top of that, despite some uncertainty around tariff policy and global trade.
About 81% of S&P 500 companies now pay a regular dividend (409 out of roughly 500), which means the vast majority of large-cap U.S. stocks are returning cash to shareholders in some form. This isn't a niche strategy. It's what most of the market does.
The Dividend Aristocrats, a group of S&P 500 companies that have raised their payouts for at least 25 consecutive years, hit a record 69 members in 2026. These companies are heavily concentrated in consumer staples, industrials, and healthcare. Not the sectors that make headlines. The sectors that make payments.
The Aristocrats have averaged roughly 6% annual dividend growth over the past decade. That means a stock yielding 2.5% today could be yielding over 4% on your original cost basis within ten years, without you doing anything except holding it.
DRIP: The Part Where Your Shares Make More Shares
If you're not reinvesting dividends, you're leaving the most powerful part of dividend investing on the table.
DRIP (Dividend Reinvestment Plan) takes each dividend payment and uses it to buy more shares of the same stock or fund. Those new shares pay their own dividends next quarter. Those dividends buy more shares. This is compounding applied to income, and over long time horizons, it's responsible for a staggering share of total returns.
Here's a concrete example:
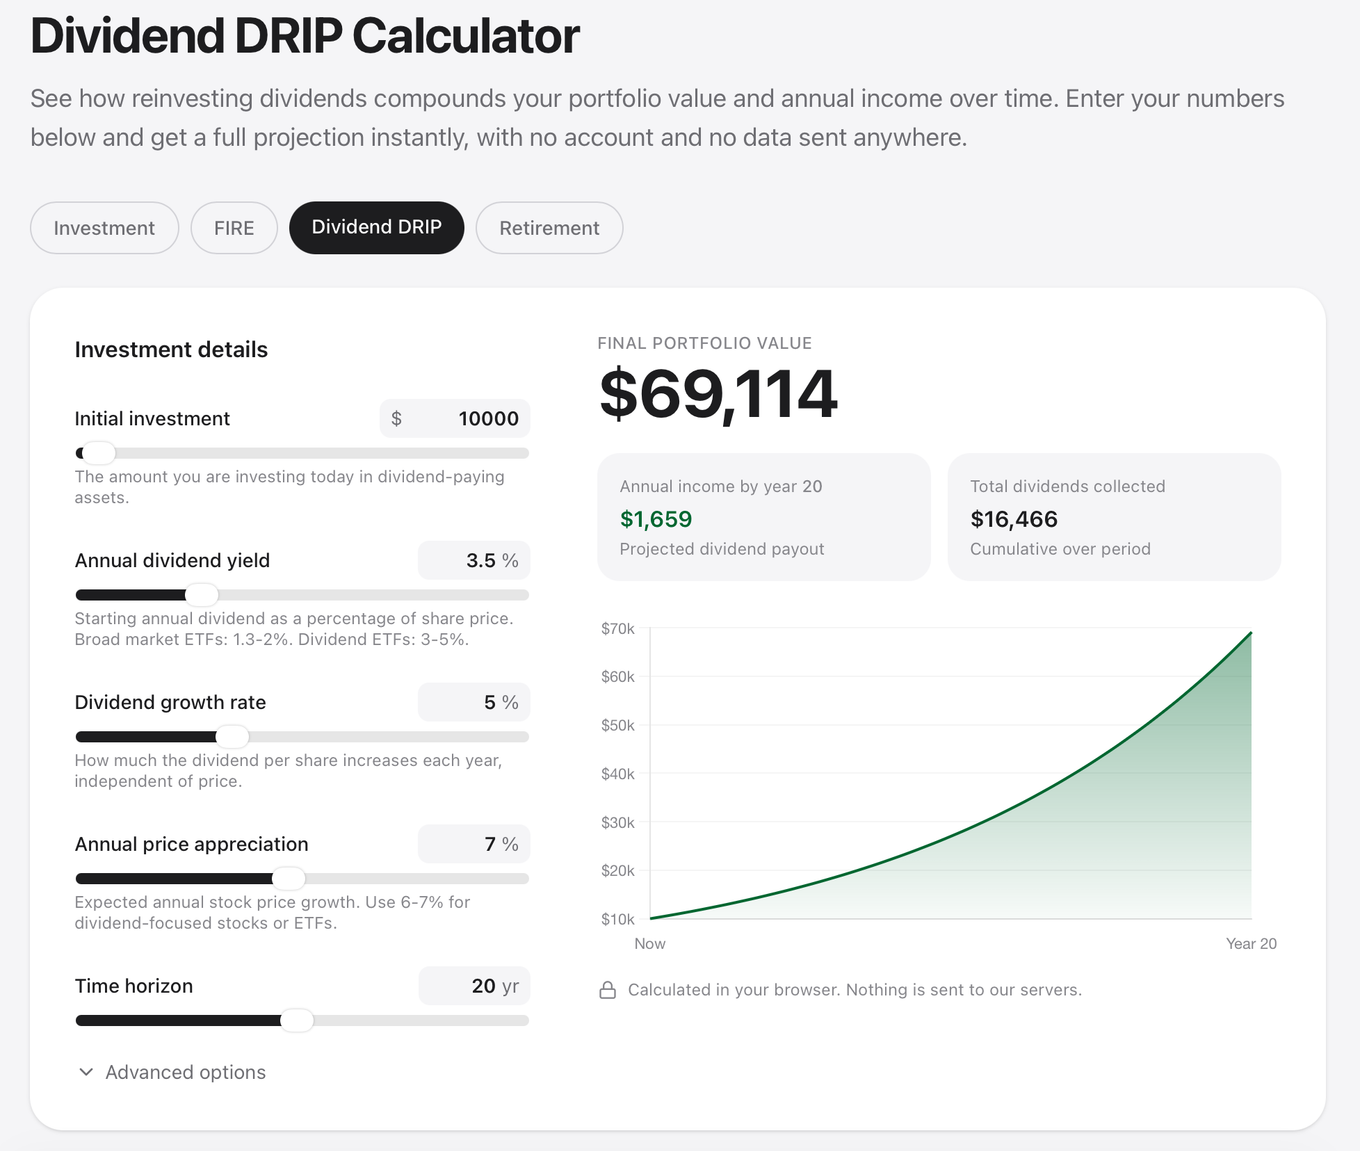
Say you own $10,000 of a stock with a 3% yield that appreciates 7% per year. In 20 years, price appreciation alone gets you to roughly $38,700. With DRIP? Closer to $56,000. The gap is entirely from reinvested dividends buying shares that then generated their own dividends.
The really interesting part: most of that gap opens up in the last five to seven years. DRIP is a slow burn that turns into a bonfire if you leave it alone long enough.
Want to model your own numbers? The DecentWealth Dividend DRIP Calculator lets you test any combination of yield, growth rate, and time horizon. It runs in your browser with no account and no data collection.
Dividend Yield vs. Dividend Growth (They're Not the Same Thing)
This is the part that trips up a lot of new dividend investors. A high yield looks great on paper. But yield without growth is just a number that slowly becomes less impressive as inflation does its thing.
Dividend yield is the annual payout as a percentage of the current share price. A $50 stock paying $2 per year has a 4% yield.
Dividend growth rate is how much the payout per share increases each year, regardless of what the stock price does. If that $2 payout grows by 8% per year, it becomes $2.16 next year, $2.33 the year after, and $4.32 in ten years.
A stock with a modest 2% yield but consistent 8% annual dividend growth will pay you more per share within a decade than one starting at 5% yield with only 2% growth. Over 20 years, it's not even close.
This is why the Dividend Aristocrats are interesting despite their relatively modest average yields (often in the 1.5% to 3% range). The growth rate is the engine. The starting yield is just where the engine begins.
Building a Dividend Calendar That Actually Works
A proper dividend calendar does three things:
- First, it shows you what's coming. Not just "you own dividend stocks" but "you have $347 in dividends hitting your accounts over the next 30 days, and here are the dates." If you're building toward replacing your income with passive cash flow, this number is the one that matters.
- Second, it shows you the gaps. Most U.S. companies pay quarterly, but they don't all pay in the same months. Some pay in January/April/July/October. Others in February/May/August/November. If you're strategic about which stocks you hold, you can build a calendar where income arrives every month instead of clustering in one quarter.
- Third, it projects forward. A good calendar doesn't just show you next month. It estimates your dividend income for next year, five years out, or longer, based on your current holdings, historical payout data, and dividend growth trends.
Tracking Dividends Without Giving Up Your Data
Here's where things get personal. Most dividend trackers and portfolio apps want you to link your brokerage accounts. That means giving a third party read access to your holdings, your transactions, your balances. Some of them use that data for analytics. Some sell aggregated insights. Some just store it on servers you have zero control over.
If you've been paying attention to what happens when centralized platforms get hacked, shut down, or quietly change their terms of service, you might not love that trade-off.
DecentWealth is a portfolio tracker for iPhone and iPad that takes a different approach. There's no account to create. No email to hand over. No server storing your portfolio. Everything lives on your device, protected by Face ID.
The dividend calendar in DecentWealth shows upcoming payments across your entire portfolio, tracks your income over time, and projects future dividend income using over 30 years of historical payout data for U.S. and international stocks and ETFs. You can see 25-year income projections based on your actual holdings.
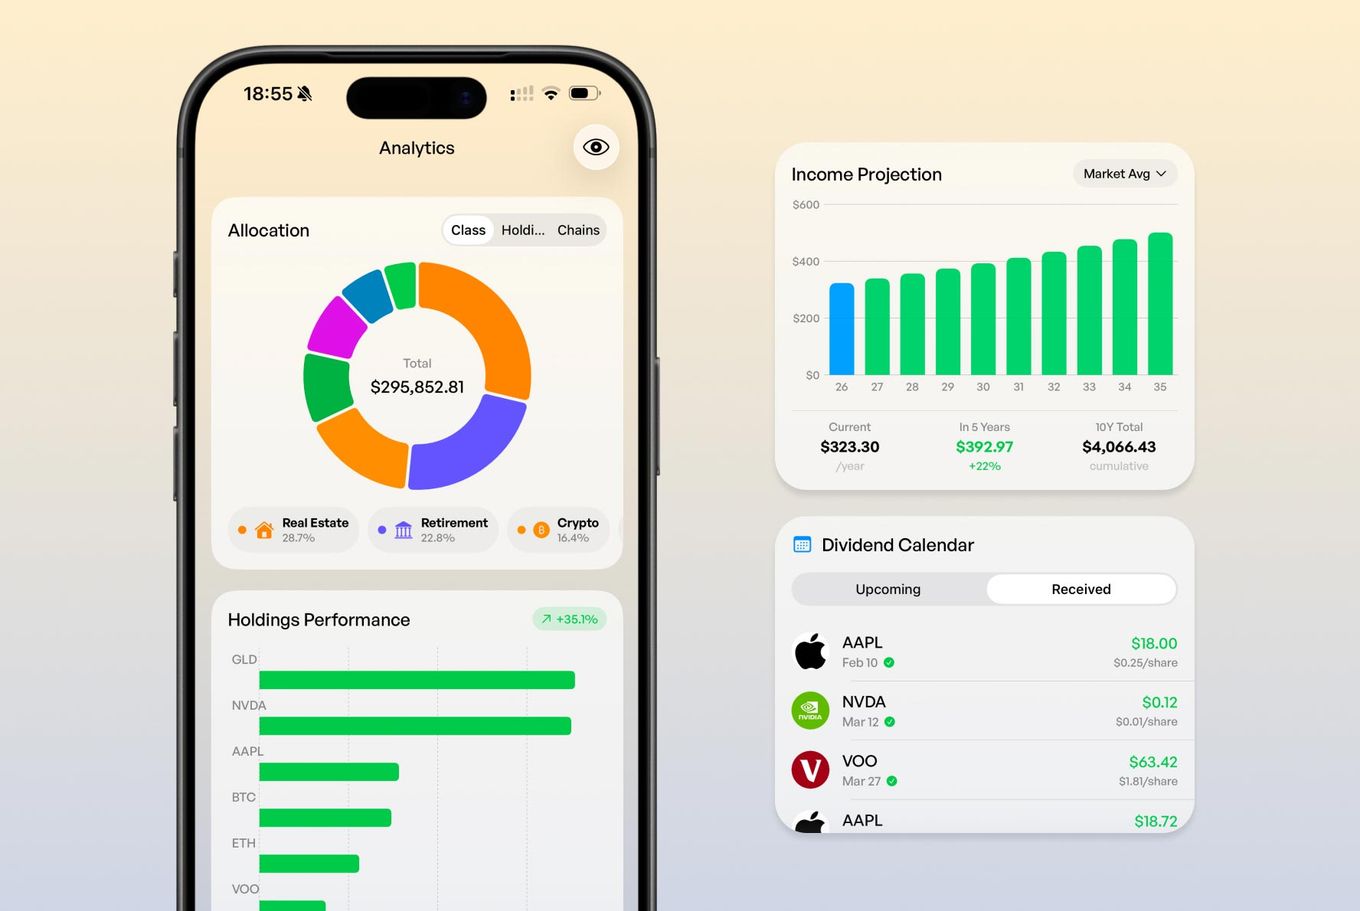
It also tracks crypto across 18 blockchains (just paste your wallet address), real estate, retirement accounts, cash, and debt. Your full financial picture, in one app, on your phone. No cloud sync required. Optional iCloud backup uses end-to-end encryption if you want it.
Know your bags without giving up your keys.
The Bottom Line
Dividends aren't exciting. That's the point. They show up, they compound, and over time they turn a portfolio into an income stream. But only if you're actually tracking them, understanding the dates, and reinvesting with intention.
If you're still managing dividend dates in a spreadsheet, or worse, just checking your brokerage randomly and hoping money appeared, you're making this harder than it needs to be.
Run the numbers in the Dividend DRIP Calculator. See what your income could look like in 10, 15, 20 years. Then download DecentWealth and start tracking the real thing, privately.
A decent amount of privacy for people with a decent portfolio.
Frequently Asked Questions
Do I have to hold the stock until the payment date to get the dividend?
Are dividends taxed differently?
What happens if a company cuts its dividend?
Does DecentWealth execute trades for me?
How do I get my data out for tax season?
Track your portfolio privately
Stocks, crypto, real estate, and more. No account required.